Mynd:TED Spread Chart - Data to 9 26 08.png

Upphafleg skrá (960 × 720 mynddílar, skráarstærð: 37 KB, MIME-gerð: image/png)

|
File:TED spread 2008.svg is a vector version of this file. It should be used in place of this PNG file when not inferior.
File:TED Spread Chart - Data to 9 26 08.png → File:TED spread 2008.svg
For more information, see Help:SVG. |
 |
| Lýsing |
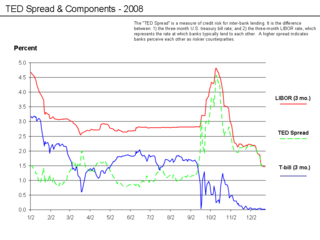
English: TED Spread and Components - 2008 LýsingThe “TED Spread” is a measure of credit risk for inter-bank lending. It is the difference between: 1) the three-month U.S. treasury bill rate; and 2) the three-month London Interbank Offered Rate (LIBOR), which represents the rate at which banks typically lend to each other. A higher spread indicates banks perceive each other as riskier counterparties. The t-bill is considered "risk-free" because the full faith and credit of the U.S. government is behind it; theoretically, the government could just print money so you will get your principal back at maturity, although there is risk of inflation (e.g., being paid back in cheaper dollars). The TED Spread reached record levels in late September 2008. The diagram indicates that the Treasury yield movement was a more significant driver than the changes in LIBOR. A three month t-bill yield so close to zero means that people are willing to forego interest just to keep their money (principal) safe for three months--a very high level of risk aversion and indicative of tight lending conditions. Driving this change were investors shifting funds from money market funds (generally considered nearly risk free but paying a slightly higher rate of return than t-bills) and other investment types.[1] These issues are consistent with the September 2008 aspects of the subprime mortgage crisis which prompted the Emergency Economic Stabilization Act of 2008 signed into law by the U.S. President on October 3, 2008. In addition, an increase in LIBOR means that financial instruments with variable interest terms are increasingly expensive. For example, mortgages, car loans and credit card interest rates are often tied to LIBOR; some estimate as much as $150 trillion in loans and derivative notional value are tied to LIBOR.[2] ReferencesSourcesThree month treasury bill rates: St. Louis Federal Reserve Bank Three month Libor rates: Bulgarian National Bank Tables Another libor source: BBA |
| Dagsetning | |
| Uppruni | eigin skrá (Original text: I created this work entirely by myself.) |
| Höfundarréttarhafi | Farcaster (talk) 03:02, 5 October 2008 (UTC) |
| Aðrar útgáfur | Derivative works of this file: TED Spread Chart - Data to 9 26 08-rebuilt.png |
Leyfisupplýsingar:
- Þér er frjálst:
- að deila – að afrita, deila og yfirfæra verkið
- að blanda – að breyta verkinu
- Undir eftirfarandi skilmálum:
- tilvísun höfundarréttar – Þú verður að tilgreina viðurkenningu á höfundarréttindum, gefa upp tengil á notkunarleyfið og gefa til kynna ef breytingar hafa verið gerðar. Þú getur gert þetta á einhvern ásættanlegan máta, en ekki á nokkurn þann hátt sem bendi til þess að leyfisveitandinn styðji þig eða notkun þína á verkinu.
- Deila eins – Ef þú breytir, yfirfærir eða byggir á þessu efni, þá mátt þú eingöngu dreifa því verki með sama eða svipuðu leyfi og upprunalega verkið er með.

|
Gefið er leyfi til að afrita, dreifa og/eða breyta þessu skjali samkvæmt Frjálsa GNU Free Documentation License, útgáfu 1.2 eða nýrri, sem gefið er út af Frjálsu hugbúnaðarstofnuninni með engum breytingum þar á. Afrit af leyfinu er innifalið í kaflanum GNU Free Documentation License. |
Original upload log
- 2009-01-27 06:16 Farcaster 960×720× (37661 bytes) '
- 2008-11-01 03:38 Farcaster 960×720× (33245 bytes) '
- 2008-10-31 02:54 Farcaster 960×720× (30560 bytes) '
- 2008-10-08 03:42 Farcaster 960×720× (30613 bytes) '
- 2008-10-05 03:02 Farcaster 960×720× (33611 bytes) {{Information |Description= |Source=I created this work entirely by myself. |Date=October 4 2008 |Author=~~~~ |other_versions= }}
Breytingaskrá skjals
Smelltu á dagsetningu eða tímasetningu til að sjá hvernig hún leit þá út.
| Dagsetning/Tími | Smámynd | Víddir | Notandi | Athugasemd | |
|---|---|---|---|---|---|
| núverandi | 14. október 2010 kl. 01:10 | | 960 × 720 (37 KB) | Hideokun | {{Information |Description={{en|TED Spread and Components - 2008<br/> ==Description== The “TED Spread” is a measure of credit risk for inter-bank lending. It is the difference between: 1) the three-month U.S. treasury bill rate; and 2) the three-month |
Skráartenglar
Eftirfarandi síða notar þessa skrá: